
Head and Shoulders Pattern:
🔹 Example:
A stock forms three peaks, with the middle peak (head) higher than the two shoulders.
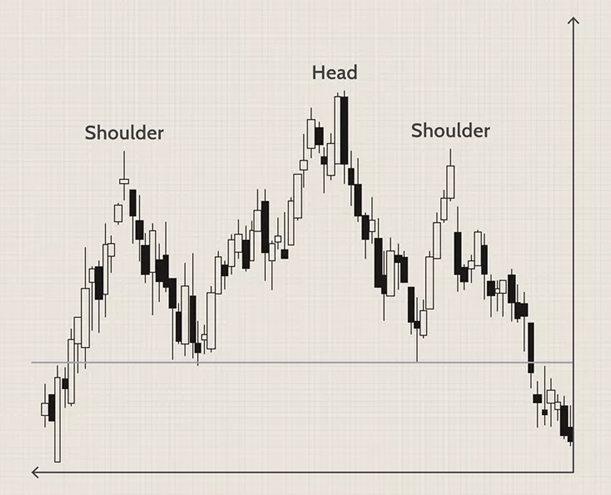
Credit: Image by Sabrina Jiang © Investopedia 2020
Inverse Head and Shoulders:
🔹 Example:
After a downtrend, stock creates an inverse pattern, suggesting an upward reversal.
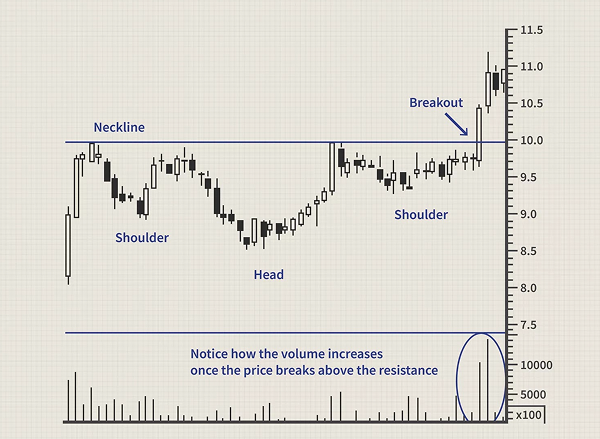
Credit: Image by Sabrina Jiang © Investopedia 2020
Double and Triple Tops/Bottoms:
🔹 Example:
Double top at resistance, indicating bearish reversal.