What is a Candlestick Chart?
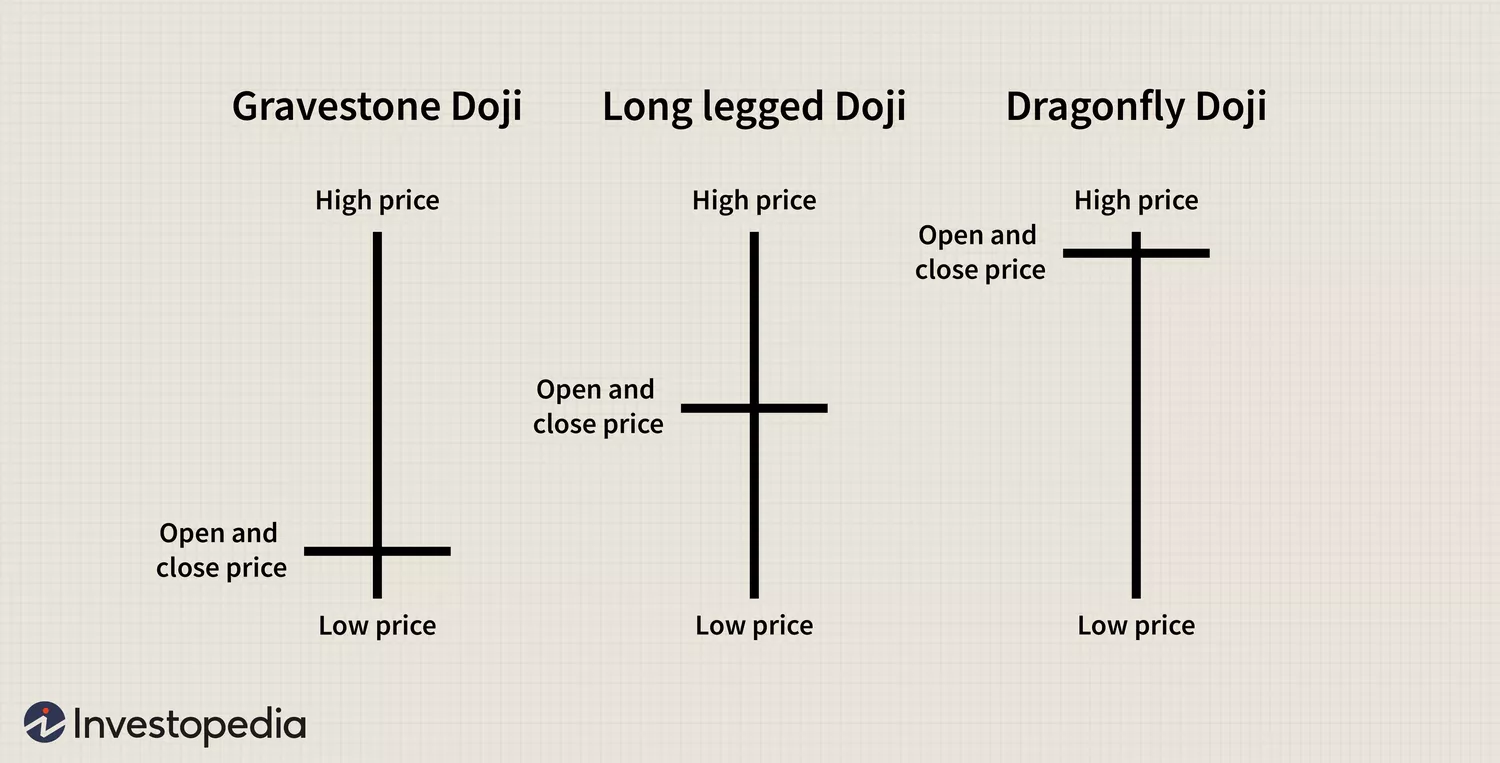
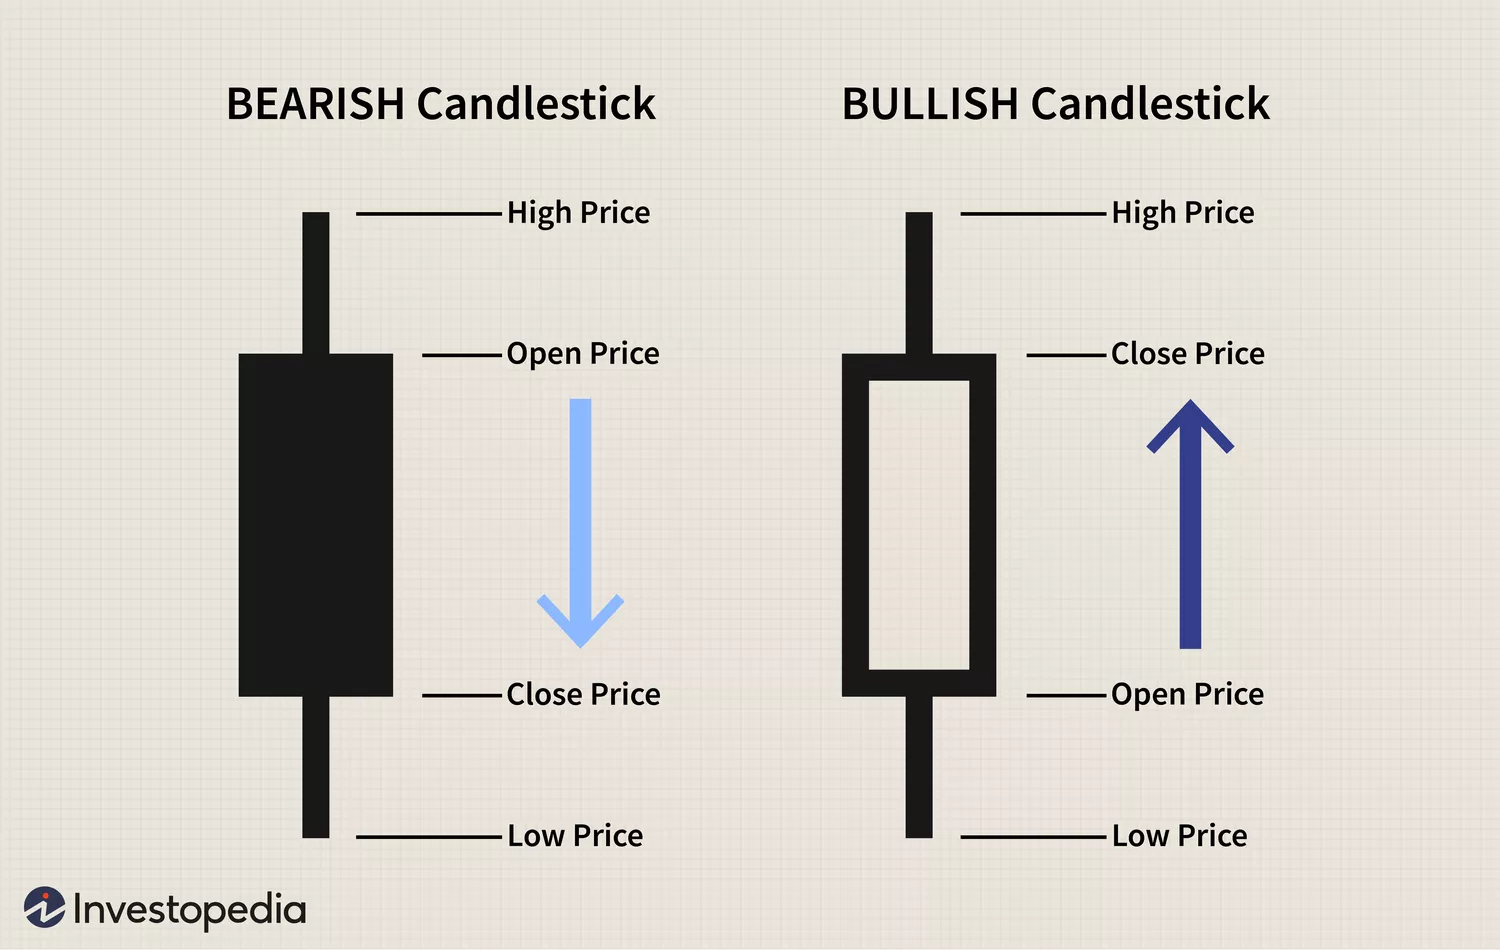
Structure of a Candlestick:
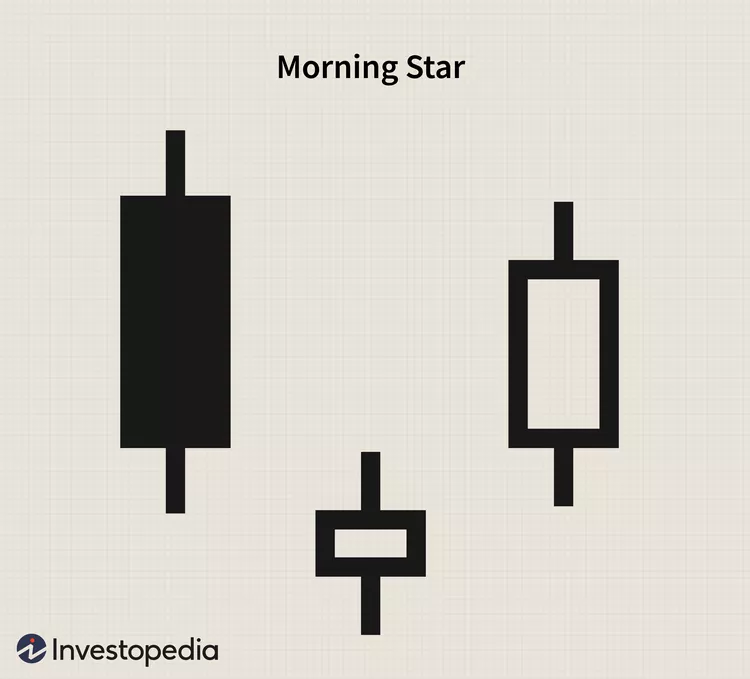
Bullish Patterns:
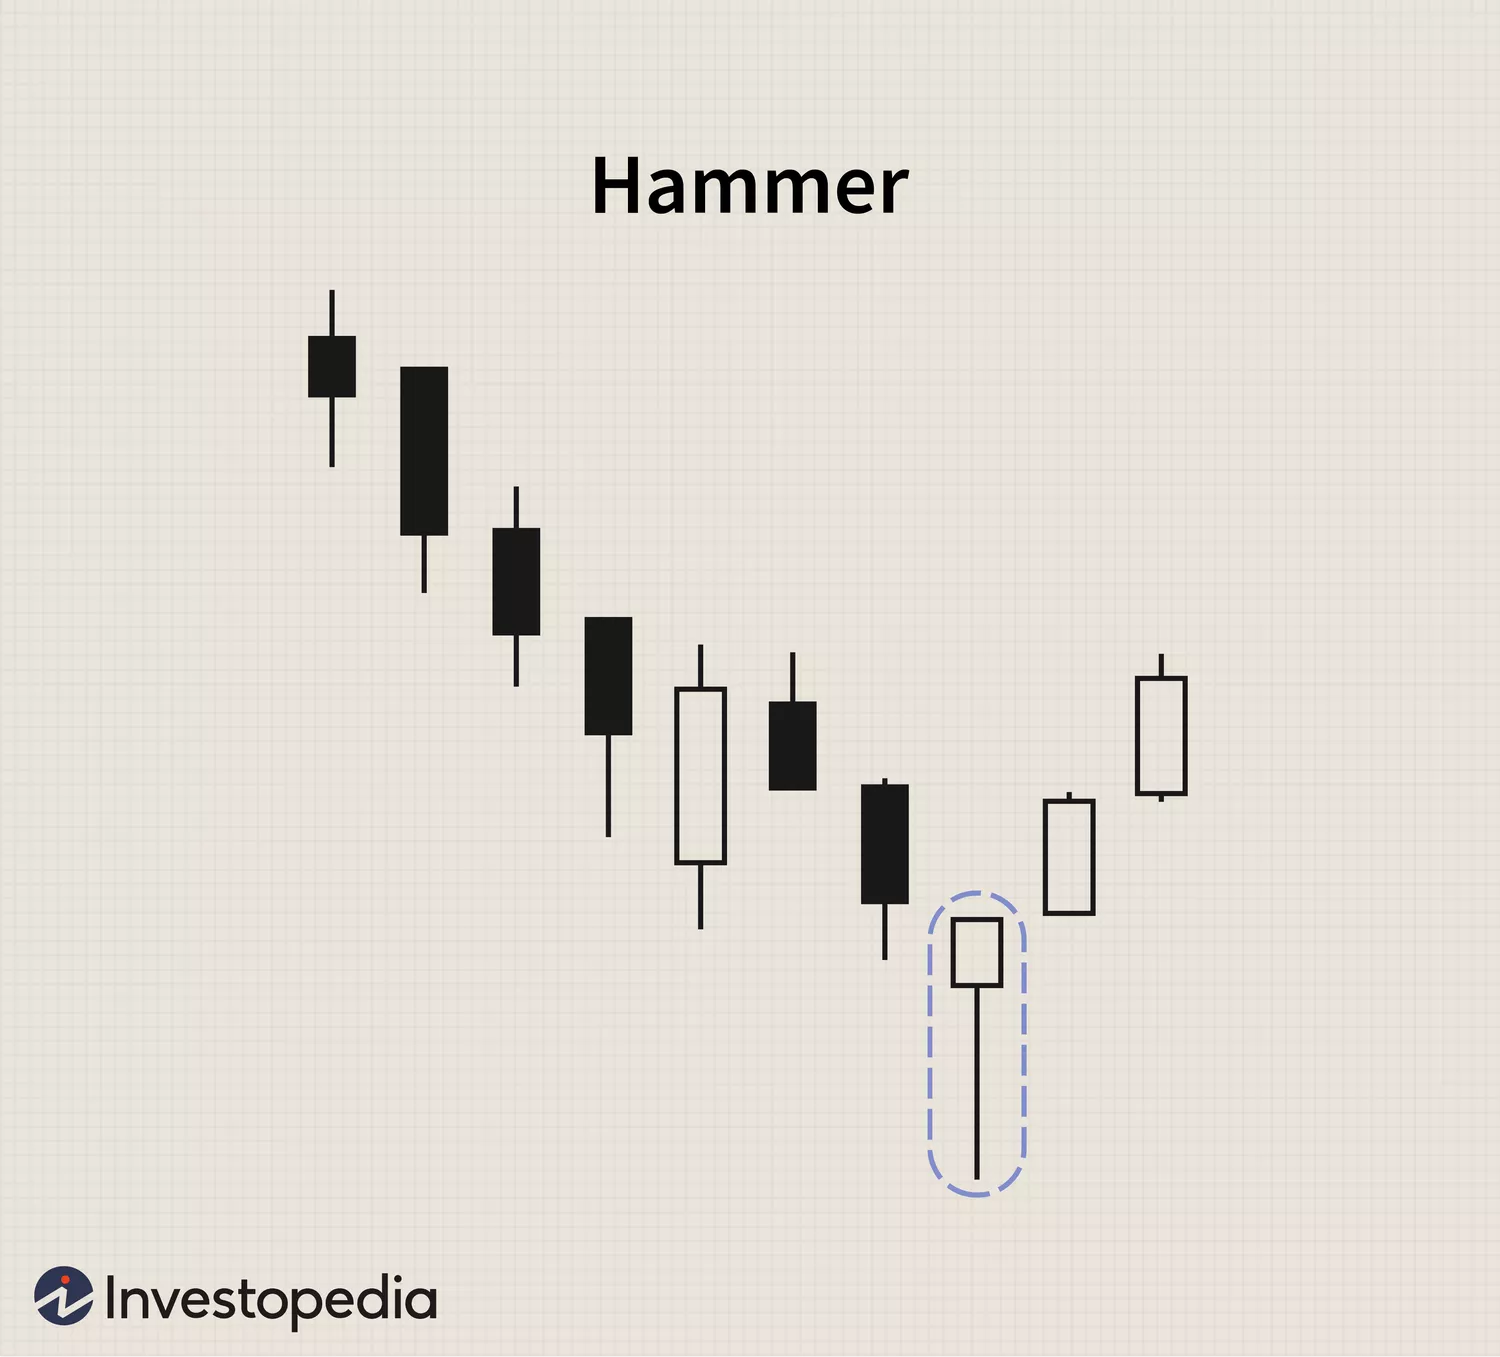
Morning Star: Three-candle pattern; bearish candle followed by small-bodied candle, then a strong bullish candle.
🔹 Example: Indicates end of a bearish trend.
Bearish Patterns:
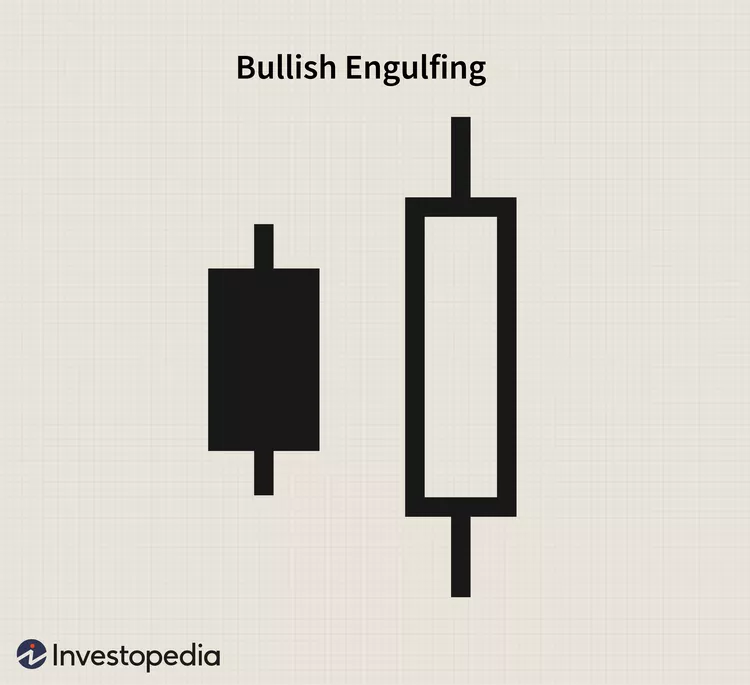
Bearish Engulfing: Large bearish candle covering previous bullish candle.
🔹 Example: Signals increased selling pressure.
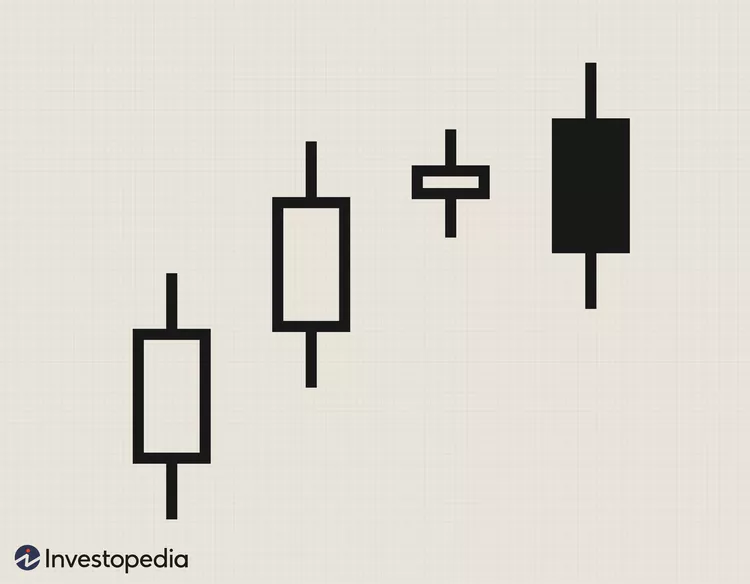
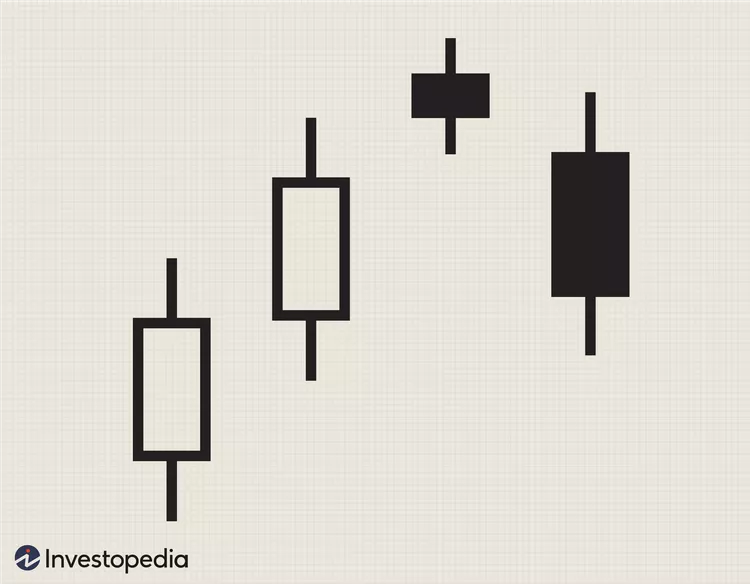
Evening Star: Opposite of morning star pattern.
🔹 Example: Indicates reversal from bullish to bearish.
Continuation Patterns:
Combining Candlesticks with Technical Indicators:
How to Confirm Signals:
Trade Example 1: Bullish Hammer
Trade Example 2: Bearish Engulfing
Common Mistakes:
How to Avoid Mistakes:
You now have foundational knowledge of candlestick patterns and practical skills to apply in trading scenarios. Sky Links Capital offers advanced resources, professional insights, and continuous support to enhance your trading skills further.
Take your next step today—partner with Sky Links Capital to begin your journey towards trading success!
Disclaimer: The information and tools provided by Sky Links Capital are strictly for educational and informational purposes only. They do not constitute financial advice, investment recommendations, or an offer to buy or sell any financial instruments. Users should make independent decisions based on their own research and, where appropriate, seek professional advice.